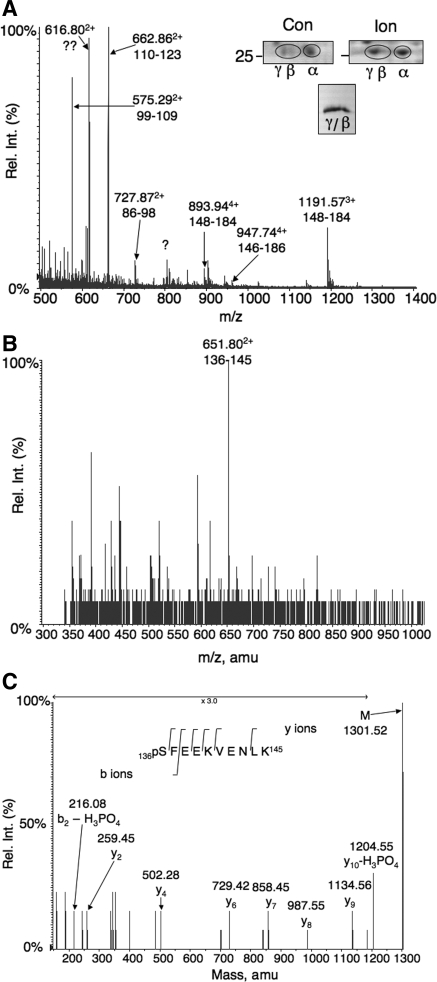
Fig. 3.
Isolation of phosphorylated D52 from rabbit gastric mucosal cells and mass spectrometry (MS) analyses. A, inset, top: regions of preparative 2D gels stained with modified Coomassie blue showing D52 migration patterns in extracts from control (Con) and ionomycin (Ion)-stimulated rabbit gastric glands. Note acidic shift from α to β/γ isoforms after ionomycin stimulation. Inset, bottom: Pooled β/γ spots from 11 preparative 2D gels after concentration on a single SDS-PAGE minigel. The identity of D52 was confirmed by Western blot using 3C10 antibody, which specifically cross-reacts with rabbit D52 (not shown). Graph: liquid chromatography (LC)/MS analysis of tryptic digests of pooled β/γ spots identifying 67% of the protein. B: mass spectrum at 52.1 min from an LC/MS analysis of a tryptic D52 digest identifying an ion at mass-to-charge ratio (m/z) 651.802+ corresponding to residues 136–145. This value matches the theoretical mass of this peptide with a single phosphorylation site [1,221.6 Da, which is increased to 1,301.6 Da by phosphorylation]. With the addition of 2 hydrogens, m/z = (1,301.6 + 2/2) = 651.8 Da. C: mass reconstruction of m/z 651.802+ identifying serine 136 as the phosphorylated form. The theoretical m/z values of the y ions identified in the figure are as follows: y2, 260; y4, 503; y6, 730; y7, 859; y8, 988; y9, 1,135; y10, 1,204. Rel. Int., relative intensity.

