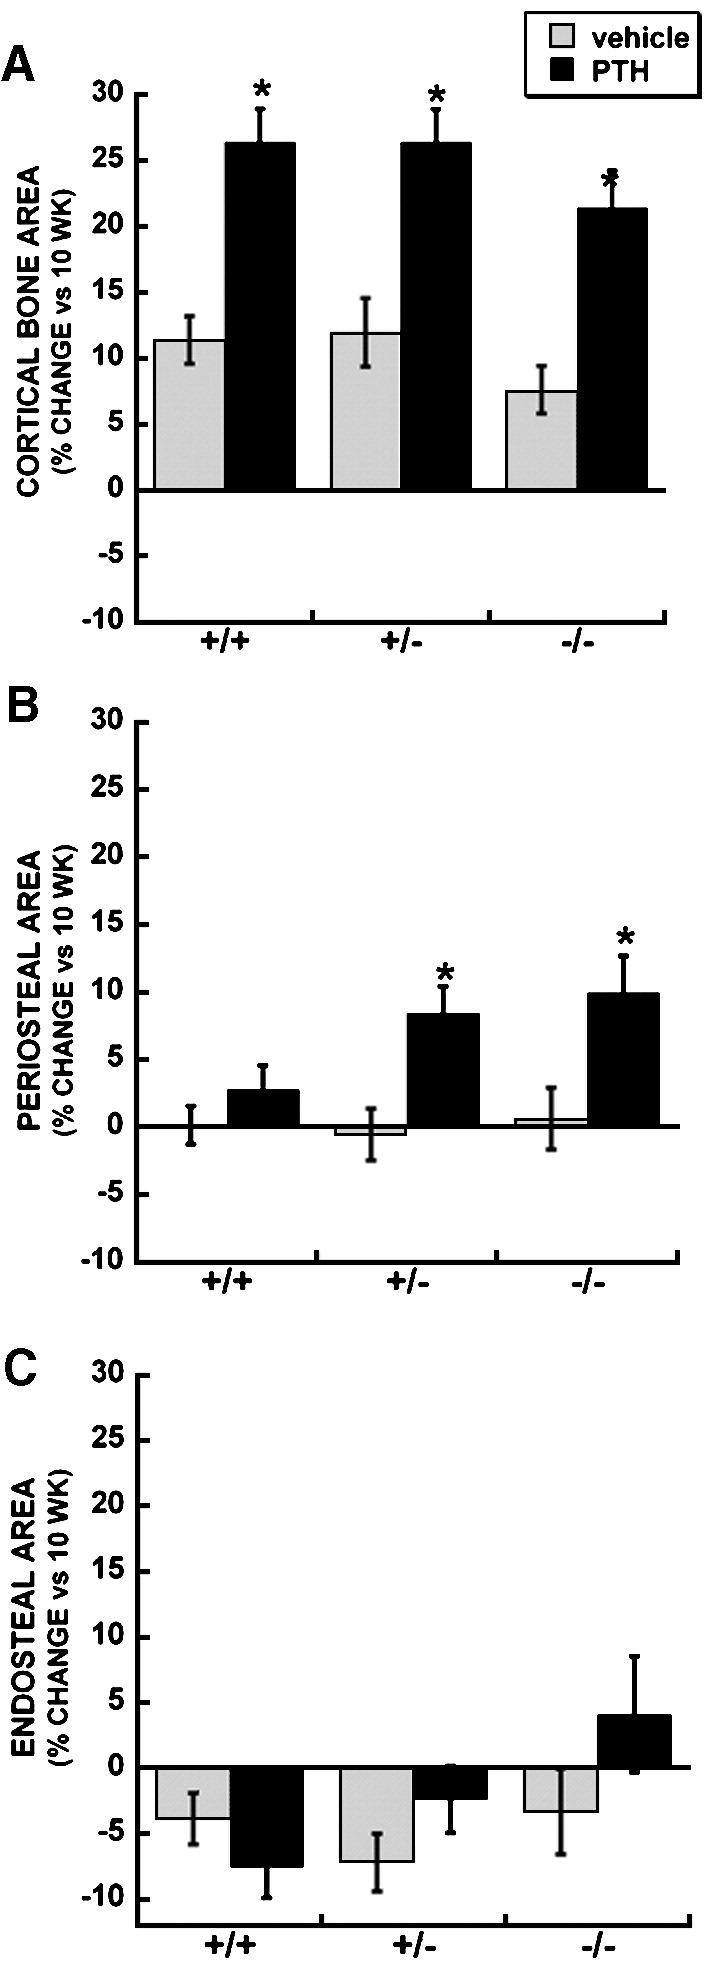
Figure 5.

Cortical bone parameters in femur of vehicle and PTH treated wild type, osteonectin+/- and osteonectin-/- mice. Percent change (vs. 10 week baseline) in A. Bone area; B. Periosteal area; C. Endosteal area. * = significantly different from corresponding vehicle treated, p ≤ 0.02.
