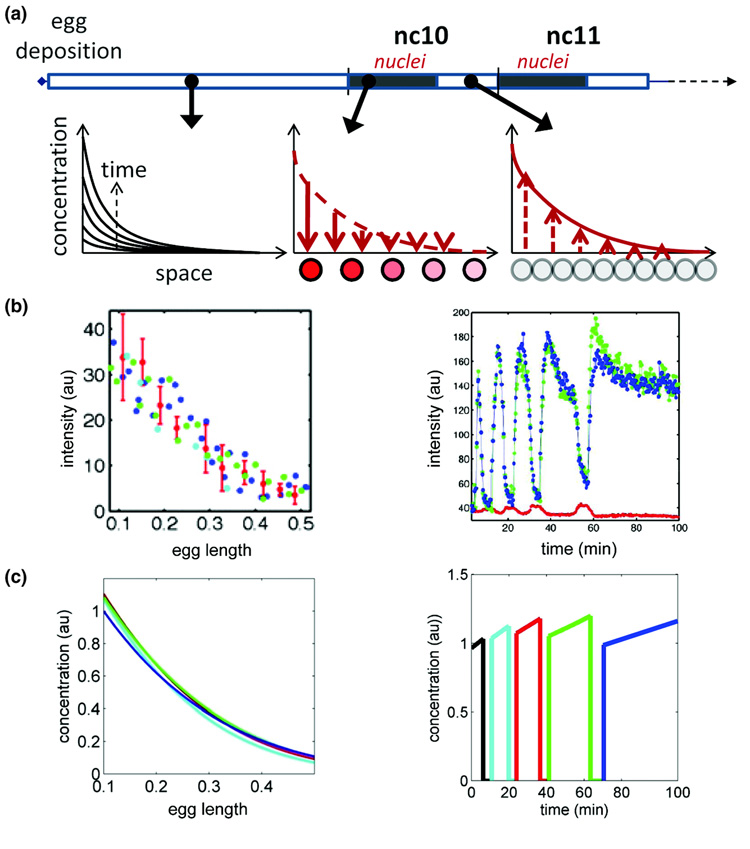
Figure 2.
(A) Two phases of nuclear divisions in the biophysical model for the formation of the Bcd gradient. The first 9 divisions occur in three-dimensions; subsequent divisions happen with nuclei arranged as a two-dimensional layer under the plasma membrane. The durations of different phases of the nuclear division cycles were measured by Foe and Alberts [11] and provide direct input for the model by Coppey et. al[10]. (B) Measurements of the dynamics of the Bcd gradient [9]. Left: the spatial profiles of the nuclear levels of Bcd remain constant over the four last nuclear cycles. Color code: the cyan, red, green, and blue lines show nuclear cycles 11, 12, 13, and 14, respectively. Right: dynamics of Bcd level within a single nucleus, followed over five nuclear division cycles. (C) Computational predictions of the dynamics of the spatial profiles of nuclear Bcd (left) and the level of Bcd inside a single nucleus (right).

