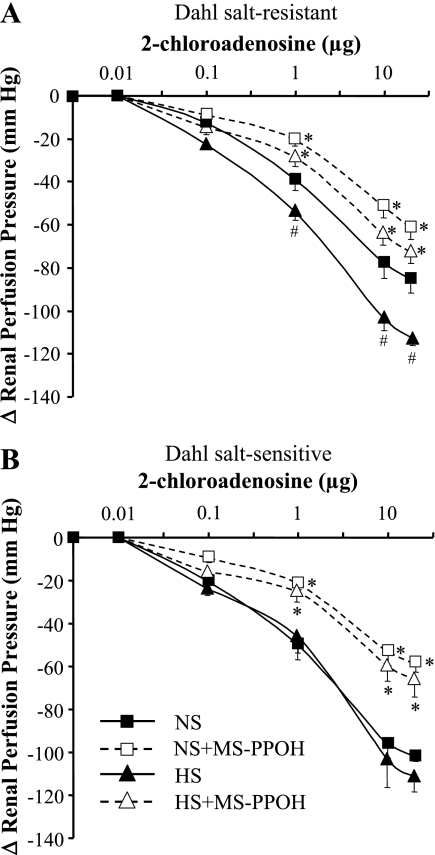
Fig. 2.
Dose-response curves to 2-CA (0.01–20 μg) in kidneys from Dahl SR (A) and salt-sensitive (SS) (B) rats fed either NS or high-salt (HS; 8.0% NaCl) diet for 7 days. Kidneys were isolated, perfused with Krebs-Henseleit buffer containing NG-nitro-l-arginine methyl ester (200 μM) and indomethacin (10 μM), and preconstricted with phenylephrine (10−7 M). Dose-response curves were obtained in the absence and presence of N-methylsulfonyl-6-(2-propargyloxyphenyl)hexanamide (MS-PPOH; 12 μM). Data are means ± SE; n = 5–9. *P < 0.05 vs. control (i.e., HS vs. HS + MS-PPOH). #P < 0.05 NS vs. HS.

