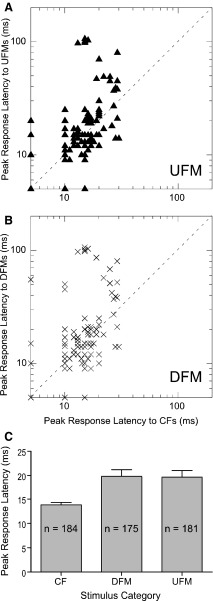
FIG. 11.
A: scatter-diagram of peak response latencies of UFMs vs. CFs. B: scatter-diagram of peak response latencies of DFMs vs. CFs. C: bar plots showing comparisons of neuron peak response latencies to CFs, DFMs, and UFMs. All latencies shown here are for responses that were obtained either before stimulus offset or that did not exceed the mean peak response latency for CFs.

