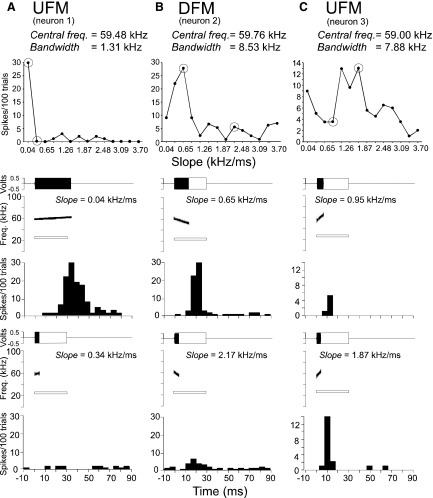
FIG. 7.
Top: line plots to show the response curves of 3 DSCF neurons (A, B, C) to the slope of an FM. Neurons show tuning (for peak responses) as FM slope increases. Bottom: amplitude envelopes (top), spectrograms (middle), and PSTH (bottom) obtained for 2 data points (encircled) on the response curve. The FM is shown by a solid, filled rectangle and the spectrogram as generated by SIGNAL software. The amplitude envelope of the CF at BFlow is shown by an unfilled, outlined rectangle and the spectrogram shown by an outlined white bar. Response curves in each column represent a single neuron's response to FMs that vary in slope between 0.04 and 4.0 kHz/ms. PSTHs in each column represent a single neuron's responses to the FMs depicted in the amplitude envelopes and spectrograms. FMs in each column are shallower in the upper panel (1st data point) than those in the lower panel (2nd data point). FM direction and stimulus parameters are indicated at the top of each panel. PSTHs (bin width = 5 ms) are based on 100 repetitions of the stimulus.

