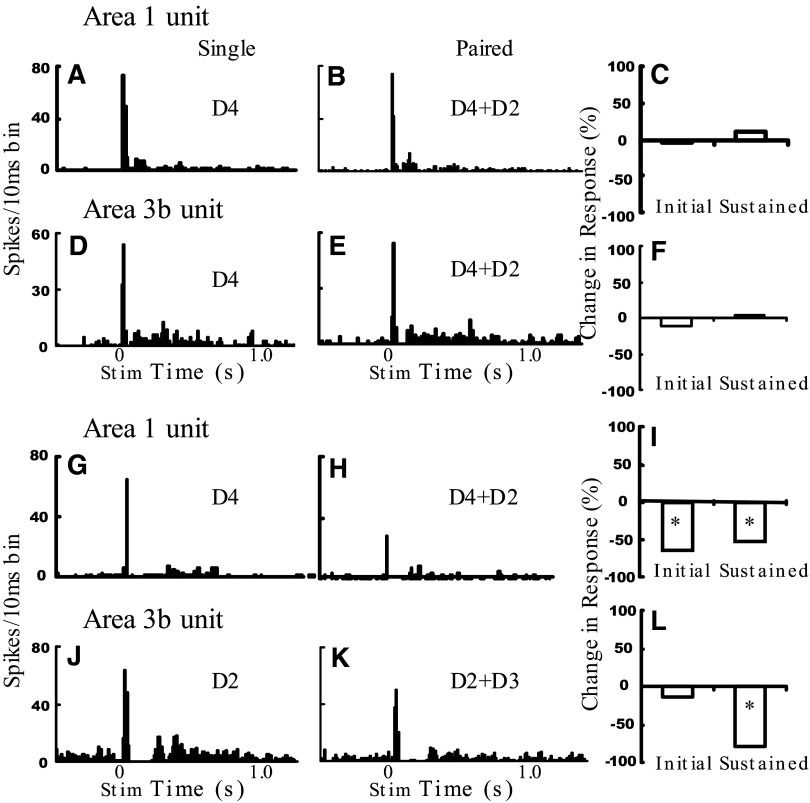
FIG. 5.
Area 1 and area 3b neural responses to digit stimulation. Sample area 1 (A–C, G–I) and area 3b (D–F, J–L) unit responses to single- (D4) and paired-digit stimulation (K: D2 + D4; L: D2 + D3). Left 2 panels: poststimulus time histograms showing the total number of spikes per 10-ms bin summed for 20 trials. Shown are responses to single-digit stimulation in the center of the unit's receptive field (far left) and paired-digit stimulation of 2 distal finger pads (middle). Right: bar graphs show the percentage change in spiking activity with paired stimulation for the initial transient and sustained response periods. *P < 0.05.

