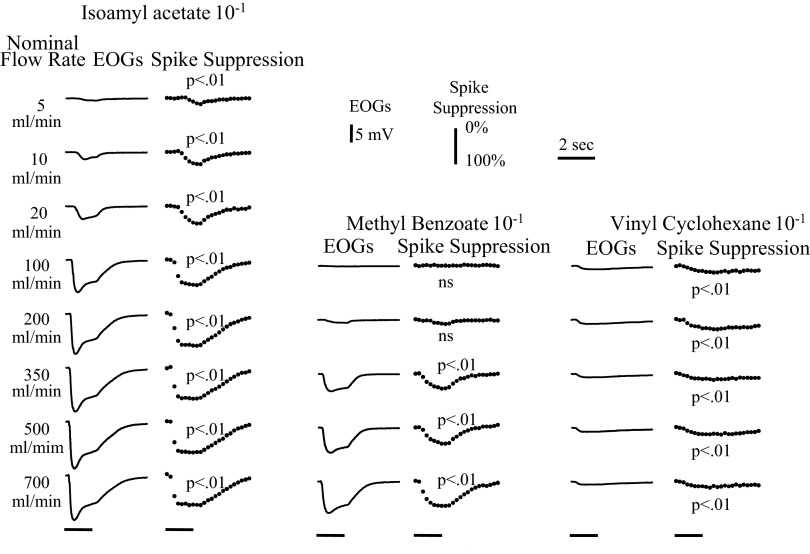
FIG. 10.
The average EOGs and corresponding spike suppression records are plotted for 3 odorants at a series flow rates from a single animal. All records have the same time base. All responses were all evoked by 1.5-s odor stimuli, indicated by the bars at the bottom of the figure. The calibration for the EOGs and spike suppression plots are shown in the top right. Significance tests for the spike suppression records were one-tailed t-tests with a criterion of P < 0.01 for the sums of the degree of suppression against the corresponding blank records.

