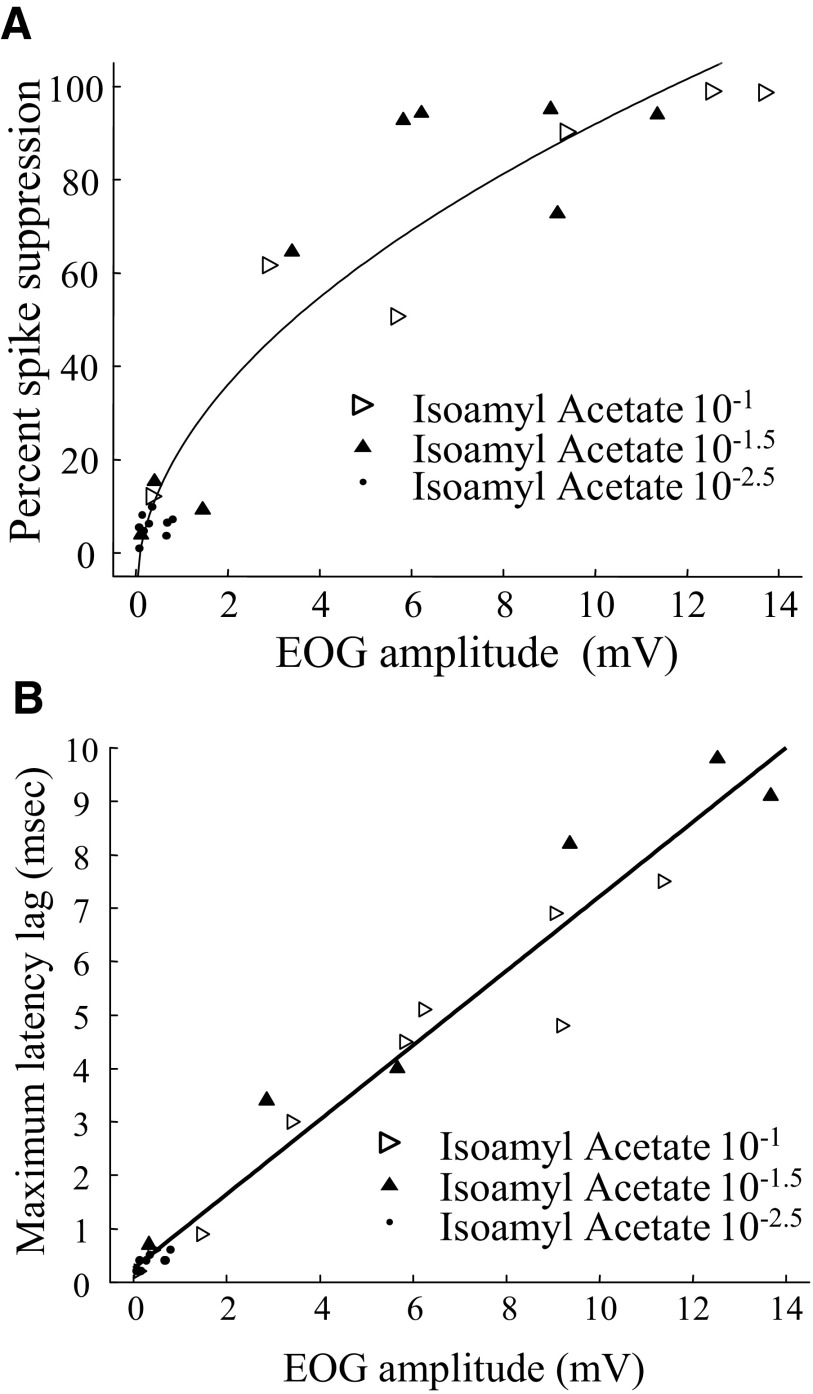
FIG. 12.
A: results from an experiment in which response size was manipulated by varying both flow rate and isoamyl acetate concentration. The result is very similar to that of Fig. 9. The fitted line is −0.09 + 0.32 × sqrt(EOG). The correlation for the fitted line is 0.95 and the linear correlation is 0.92. The nonlinearity occurs because the spike suppression ratio cannot go beyond 100%. However, some of the response did approach 100% spike suppressio. B: spike latency data from the same experiment as Fig. 10 showing that the spike latencies are also very sensitive to odor stimulation. In this case the relationship is clearly linear.

