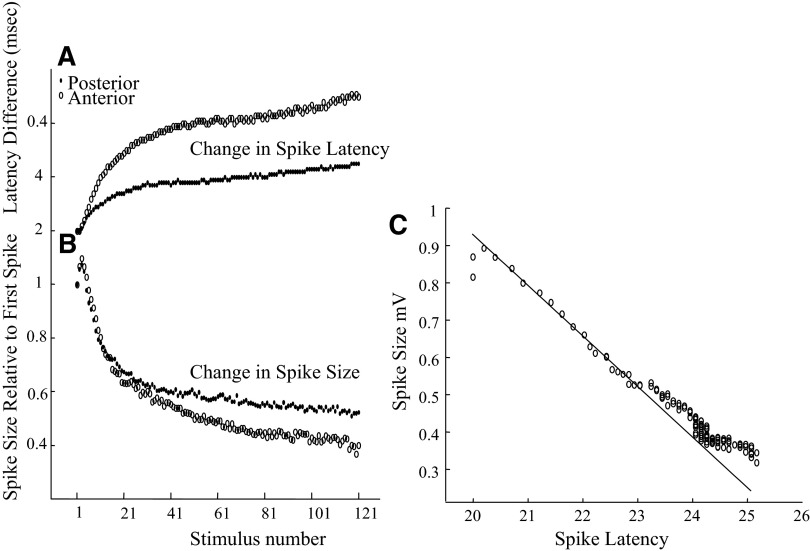
FIG. 3.
A: change in antidromic spike latency with repetitive stimulation at 30 Hz for 2 recording sites in the dorsal epithelium. The change is represented as differences from the 1st response (based on averages of 10 sweeps). The circles represent the more anterior site, and the dots represent the more posterior site. The difference is greater for the site more distance from the stimulus. B: change in spike size with repetition. Note that the spike size increased for the 2nd through the 4th pulses and decreased sharply. The anterior site is slightly more affected by prolonged repetition. The measurements are based on the average of 10 sweeps. C: spike size decreased in a nearly linear fashion after the 1st few stimuli of the train, although after prolonged stimulation, the spike size changed more slowly than the spike latency. The form of this curve was similar for the 2 sites.

