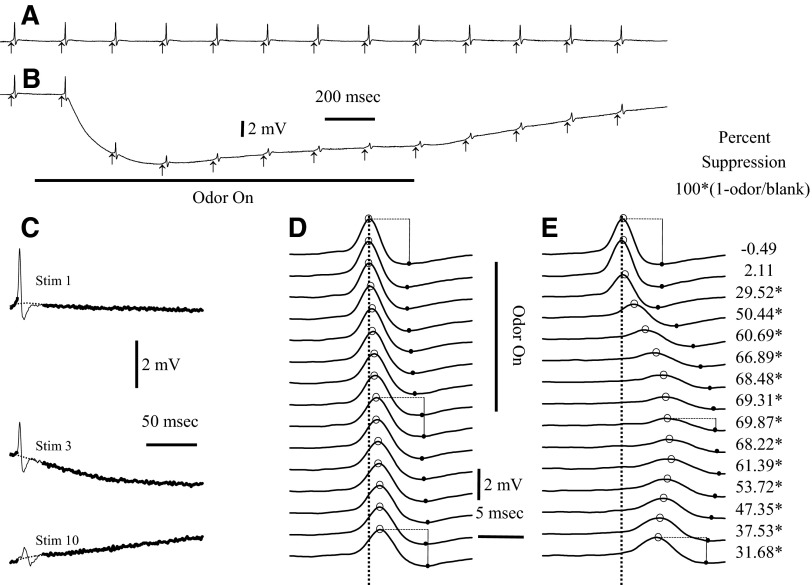
FIG. 4.
The antidromic spikes at the dorsal sites were suppressed if the stimuli were applied during strong odor stimulation. Responses to a train of electrical stimulation without odor are compared with response during odor presentation. Electrical stimuli to the bulb surface were presented at a rate of 5/s. A: average responses to the electrical stimulus for a blank (n = 5). Arrows indicate the time of the electrical stimuli (stimulus artifacts removed). B: a 1.5-s presentation of methyl benzoate (10−1 of saturation) depressed the size of the averaged antidromic spikes (n = 5 odor stimuli). The traces in A and B are truncated before the end of the recording. Both the electroolfactogram (EOG) and the spike height returned to baseline by the end of the 4-s recording. C: spikes 1, 3, and 10 from B. Because the EOG and the decay after the shock could distort measurements of the peak, the peak measurements were made from a baseline estimate (dotted line) based on a fit to the points before and after the spike (heavy line). D: control spikes of A with the estimated baseline subtracted. With repeated shocks in a train, the peak latency (indicated by circles) shifts slightly relative to the peak latency of the 1st spike (dotted vertical line). The spikes also broaden during repeated stimuli as shown by the increased latency of the minimum voltage after the peak (filled circles). E: the spikes during the odor response with the estimated baseline subtracted (as in B). The peaks and minimums of the spikes are indicated with open and filled circles as in D. The amplitudes of spikes in the blank and odor trials were calculated as the difference in voltage between the peak and the minimum, as shown for trials 1, 9, and 15. The percent spike suppression was calculated from the ratio of the amplitudes in the odor/blank trails, as shown to the right of E. The statistical significance of differences in spike amplitude was assessed with t-test. In this example, there were 5 blank and 5 odor trials. *Times at which the spike suppression was significant at the P < 0.01 level.

