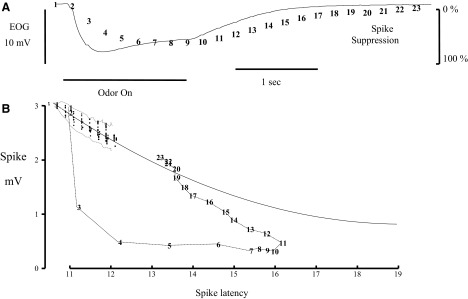
FIG. 6.

Spike suppression during odor responses is greater than would be expected from the antidromic latency. A: EOG record from Fig. 4 (solid line) and plots the spike suppression computed for each successive antidromic spike in the sequence (numbers). The key for spike suppression is at the right. B: antidromic spikes during the blank and odor stimulus against the corresponding spike latency as in Fig. 3C. For the blank, the individual responses for the 5 repetitions are plotted as filled circles bordered by a dotted line indicating the SD. The solid line extended from those points is an estimate of the latency-size relationship based on a higher frequency test at the same recording site. The spikes during the odor response are marked with the same numbers as in A and are connected by lines to help clarify the sequence.
