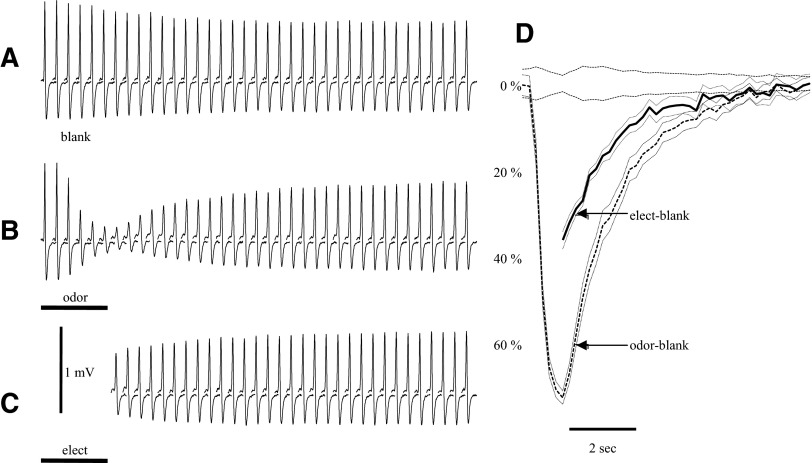
FIG. 9.
The slow decay of response suppression does not necessarily represent continued activity in olfactory nerve. On the left are overlapped insets of average antidromic spikes recorded in different conditions. A: responses during a blank (25 sweeps). B: response from the same site during odor stimulation with isoamyl acetate (25 sweeps). C: recovery after a train of high-frequency antidromic shocks (37 Hz) that depressed the spike size (22 sweeps). Measurements during the high-frequency train were not possible because the shocks overlapped the spike. All test stimuli are at 200-ms intervals. D: mean and SE for the spike suppression curves vs. the SE around the 0 line for the blanks. The values of the suppression ratio are indicated by the scale at the left. Both odor and electrical responses decay very slowly.

