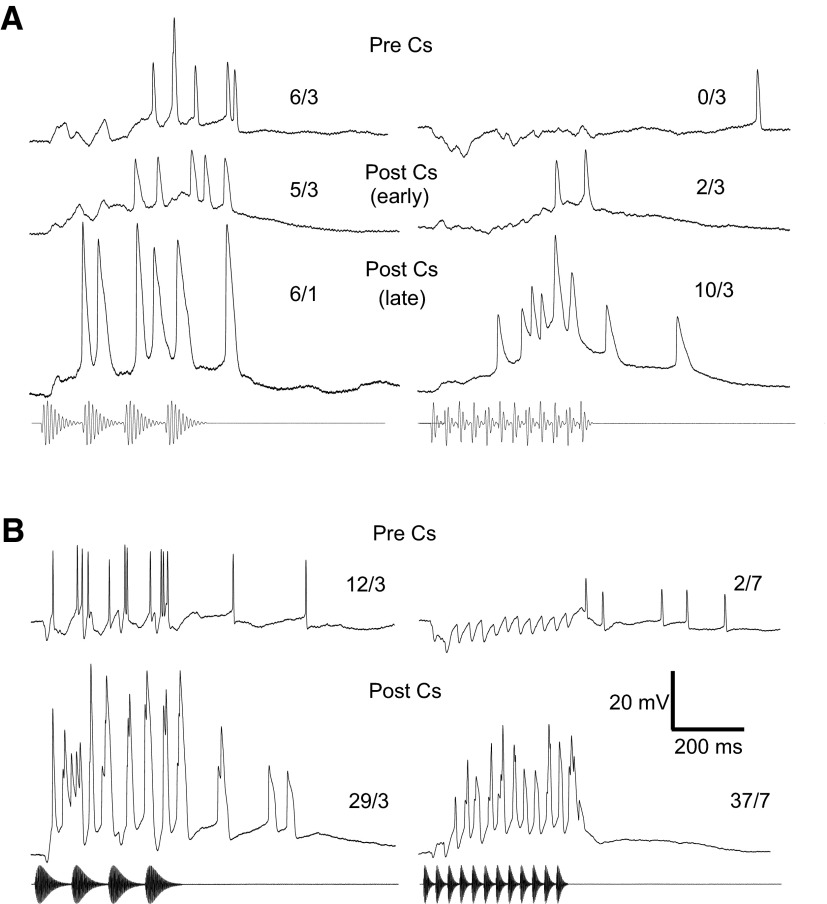
FIG. 10.
A and B: averaged responses of 2 long-interval-selective neurons to 10-Hz (left) and 30-Hz AM (right) before (Pre Cs) and after (Post Cs) Cs+ attenuated inhibition. Middle and bottom traces in A and B, respectively, show the responses after Cs+ began to take affect as evidenced by the broadening of the action potentials. The bottom recording traces in A show the responses after actively loading the neuron with Cs+ by briefly injecting positive current. The numbers above each trace are the number of spikes/number of repetitions. A: resting potential = −72 mV; BEF = 190 Hz; 84 dB SPL. B: resting potential = −62 mV; BEF = 600 Hz; 57 dB SPL.

