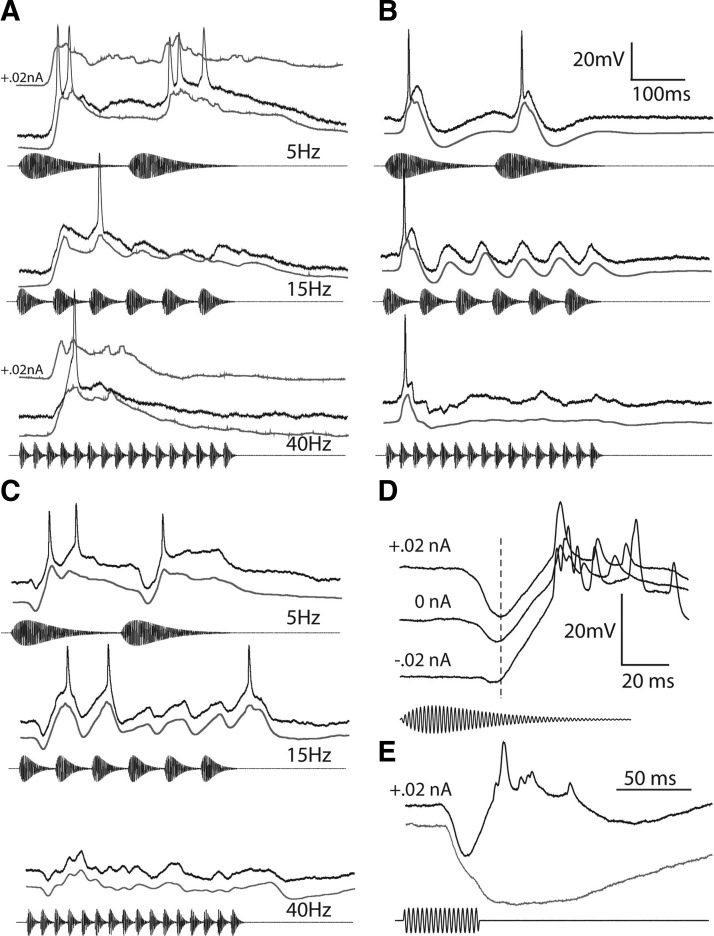
FIG. 4.
Intracellular recordings from representative long-interval units. A–C: responses of 3 neurons to 5-Hz AM (top traces), 15-Hz AM (middle traces), and 40-Hz AM (bottom traces). The black traces are responses to single presentations of the stimulus. The gray traces are averages of several repetitions after recording was median filtered with a time constant of 5 ms to remove spikes. The top gray traces in A at 5 and 40 Hz are averaged responses recorded with +0.02-nA current clamp. A: resting potential = −72 mV; best excitatory frequency (BEF) = 300 Hz; 65 dB SPL. B: resting potential = −79 mV; BEF = 600 Hz; 61 dB SPL. C: resting potential = −61 mV; BEF = 300 Hz; 72 dB SPL. D: current-clamp recordings, at the levels shown, of responses of the cell in C to 5-Hz AM stimulus. E: positive current-clamp recordings of responses of the same neuron to tone bursts of 300 Hz (black trace) and 660 Hz (gray trace).

