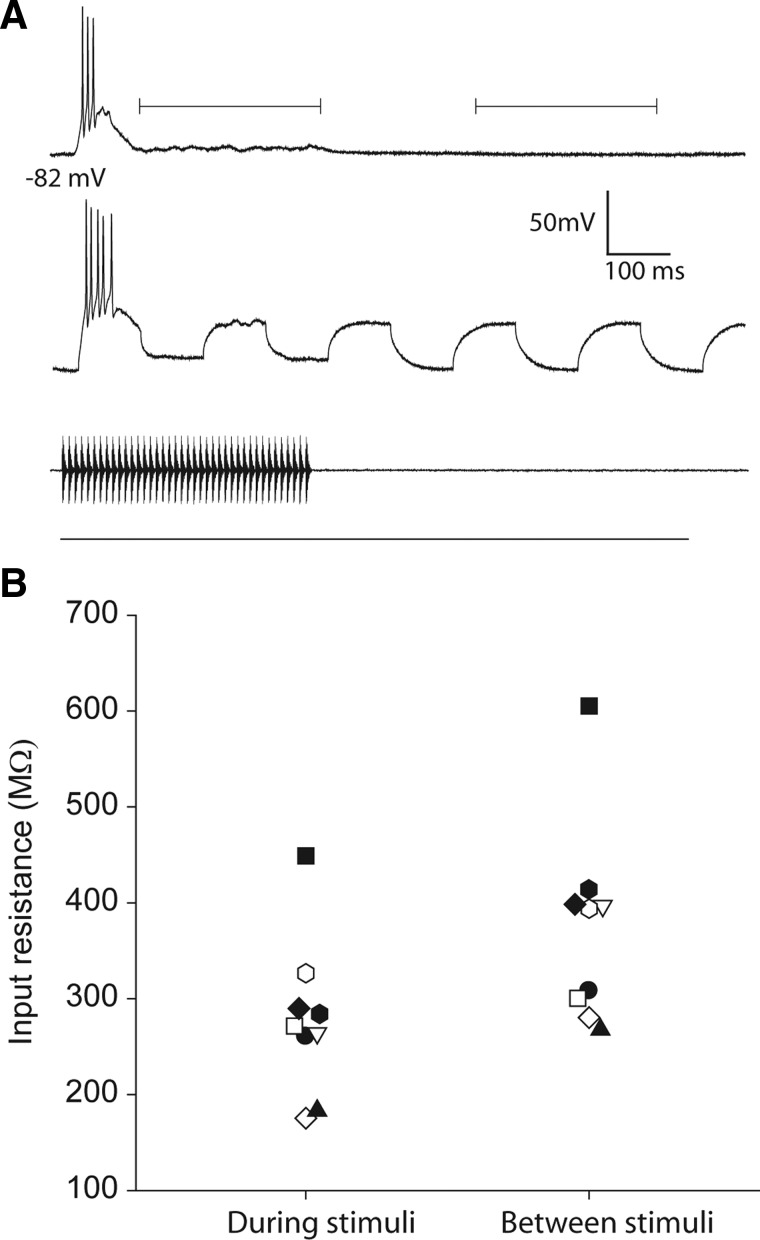
FIG. 8.
A: recordings from a long-interval neuron during and after presentation of 100-Hz AM stimuli alone (top) or while −0.1-nA current pulses were delivered (bottom) to measure the input resistance of the cell. Brackets indicate where measurements were taken during (left bracket) and between stimuli (right bracket). B: the input resistances of nine neurons (each neuron denoted by a different symbol) measured during and between the responses to stimuli.

