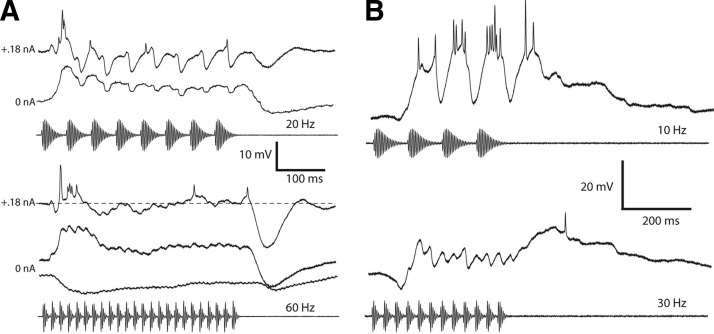
FIG. 9.
A, top: averaged responses of a neuron to 20-Hz AM recorded with +0.18-nA current (top trace) and 0-nA (bottom trace) current clamp. Bottom: averaged responses of same neuron to 60-Hz AM recorded with +0.18-nA current clamp or no current injected (middle trace). Bottom trace: averaged response to 60-Hz AM with a carrier frequency (600 Hz) that primarily elicited inhibition. Resting potential = −74 mV; BEF = 325 Hz; 74 dB SPL. B: averaged responses of a neuron with an offset response at fast AM rates to 10-Hz AM (top) and 30-Hz AM (bottom panel). Resting potential = −77 mV; BEF = 180 Hz; 77 dB SPL.

