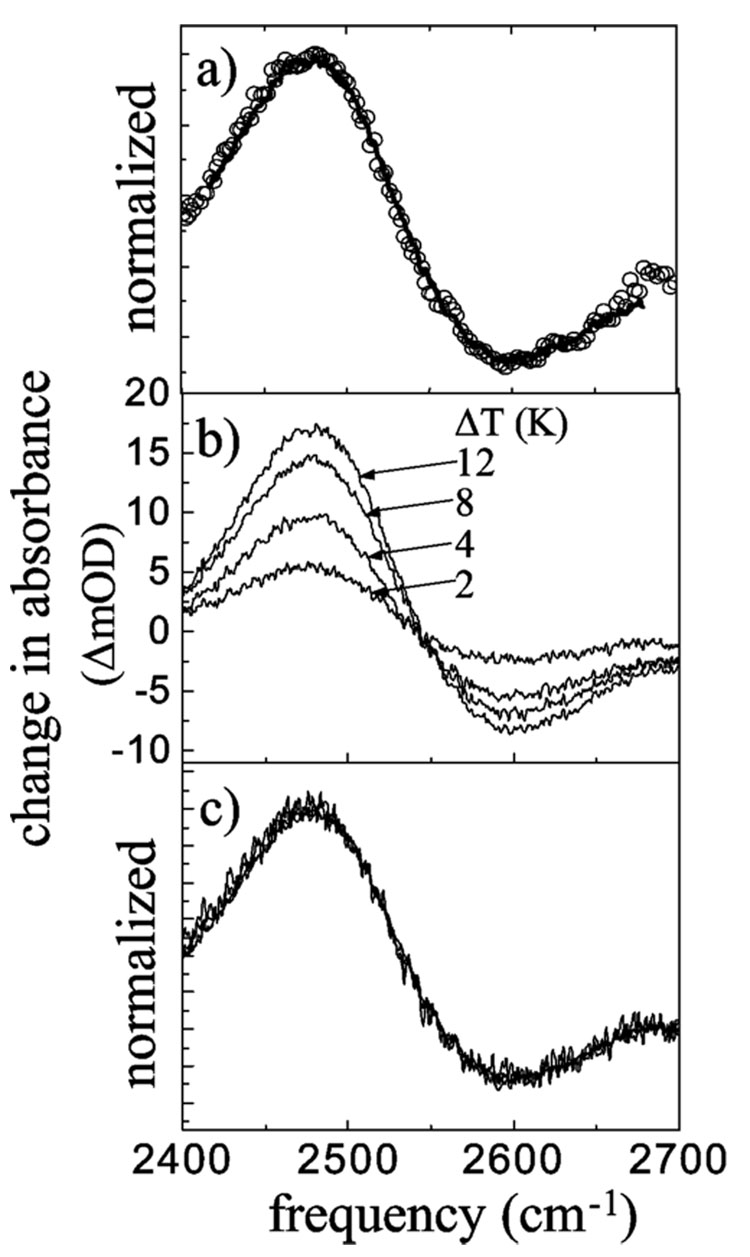
Figure 2.
(a) Comparison of the transient absorption spectrum of the OD stretch of HOD in H2O at Tw = 30 ps (circles) to the linear FT-IR temperature difference spectrum for a temperature difference of 2 K (solid curve). The amplitudes of the spectra have been normalized. (b) Temperature difference spectra at 2, 4, 8, and 12 K temperature difference with respect to room temperature. The differences are in units of mOD. (c) The amplitudes of the spectra in (b) are matched. No other changes are made. The spectra for different ΔT values are identical, showing there is only a change in size, not spectral shift or shape. The results are consistent with a hydrogen bond breaking mechanism.

