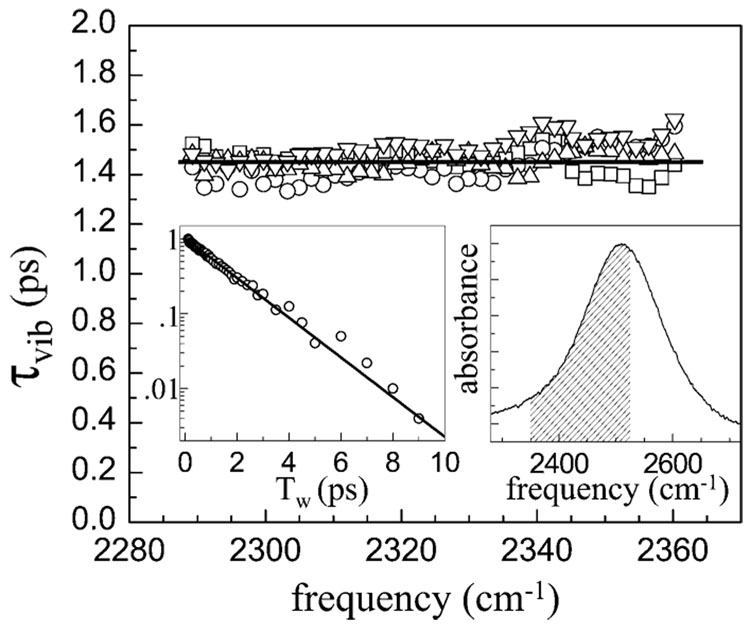
Figure 4.
The vibrational lifetime of the OD stretch of HOD in H2O as a function of frequency was measured on the low-frequency side of the 1 → 2 transition to avoid perturbation by the 0 → 1 transition and its photoproduct spectrum. The vibrational lifetime is frequency independent as found for the full spectrum using singular value decomposition (see Figure 1b). The inset on the left is a semilogarithmic plot of data at 2340 cm−1 and a fit demonstrating that the excited hydroxyl stretch decays exponentially. The inset on the right shows the linear absorption spectrum, and the shaded area shows the range of 0 → 1 transition frequencies spanned by the lifetime measurements of the 1 → 2 transition (see the text).

