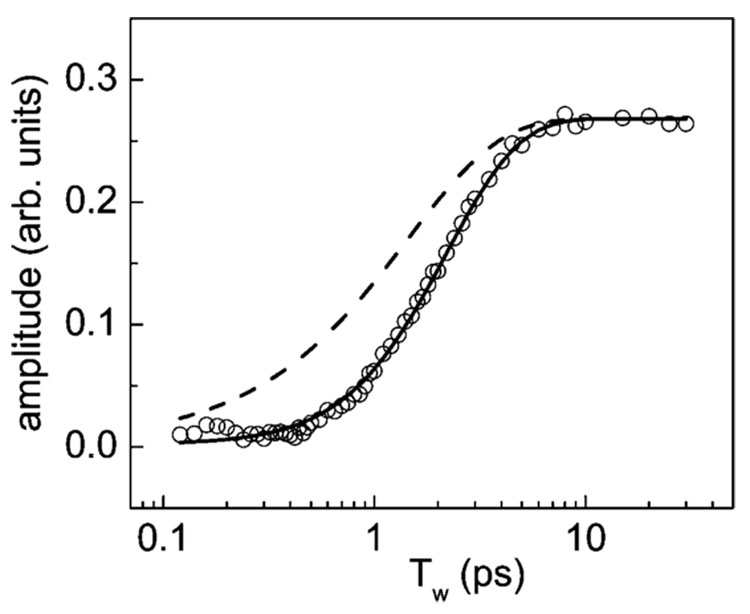
Figure 6.
Experimentally determined amplitudes of the photoproduct spectrum (circles) as a function of Tw. The solid curve through the data is a fit to the data using eq 1. The fit gives the hydrogen bond breaking time following vibrational relaxation as 0.8 ps. The dashed curve would result if the spectral change occurred immediately, which rules out both the direct predissociation mechanism for hydrogen bond breaking and a simple combination band shift caused by excitation of lower frequency modes populated by vibrational relaxation.

