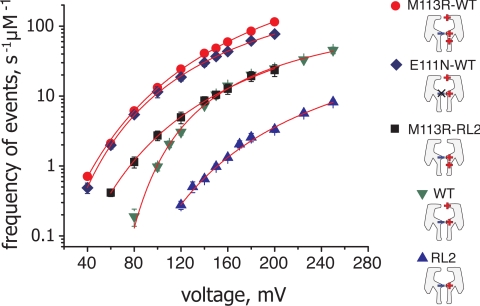
Fig. 5.
Voltage dependence of the frequency of DNA translocation plotted on a logarithmic scale. Only type A and C events are included in the analysis. Red circles, M113R-WT; blue diamonds, E111N-WT; black squares, M113R-RL2; green inverted triangles, WT; blue triangles, RL2. The lines show fits of the data with Eq. 1.

