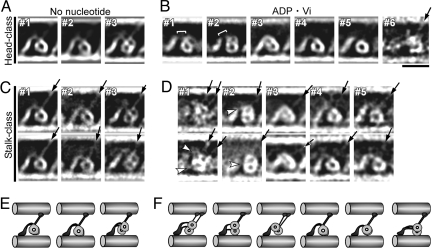
Fig. 5.
Averaged images after classification. Shown are no-nucleotide (A and C) and ADP·Vi (B and D) averages. A total of 1,062 no-nucleotide images and 988 ADP·Vi images were classified first according to the heads (A and B) and then according to the stalks (C and D). Protein is white. Two selected stalk-classes are shown below each head-class. The numbers of images in averages are: 736, 257, and 69 for #1–3 (A); 188, 144, 74, 73, 72, and 6 for #1–6 (B); between 19 and 269 (C); and 9–40 (D). (E and F) Interpretation of each class-average. Stalks (arrows), and a low-density region between the tail and head (bracket) containing linkers (white arrowheads) are indicated in some images. (Scale bar: 20 nm.)

