Fig. 5.
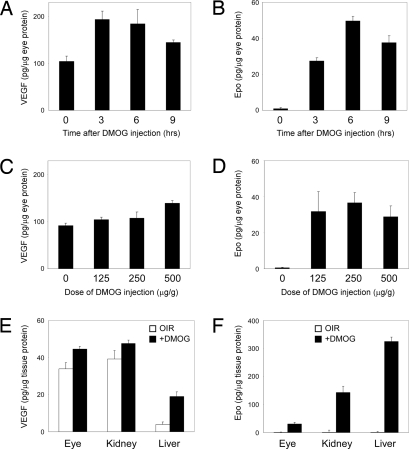
Increased expression of Epo and VEGF after DMOG injections. ELISA for ocular VEGF (A and C) and ocular Epo (B and D) demonstrates time and dose–response to i.p. DMOG. Hepatic Epo synthesis (F) is dramatically increased by DMOG, even when compared with renal Epo expression. VEGF protein is increased by DMOG in these organs (E) but not as much as Epo.

