Fig. 2.
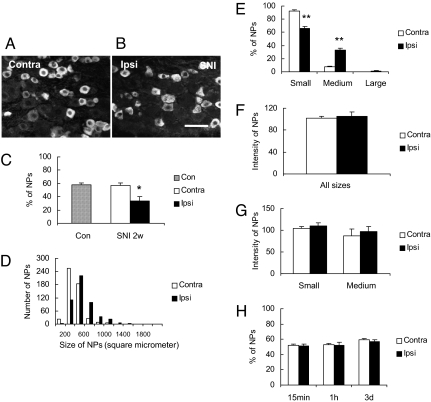
Expression of PLCβ3-LI in DRGs. (A and B) Immunofluorescence micrographs showing PLCβ3-IR neurons in contra- (A) and ipsilateral DRGs (B) 14 days after SNI. (C) Percentage of PLCβ3-IR NPs in control DRGs and 2 weeks after SNI. The lesion causes an almost 50% decrease. (D) Size distribution of PLCβ3-IR NPs in contra- or ipsilateral DRGs 2 weeks after SNI (500 NPs were measured in each group). There is a trend toward expression of PLCß3 in larger NPs after lesion. (E) Proportion of PLCβ3-IR NPs in small (<600 μm2), medium (600–1,400 μm2), or large (>1,400 μm2) NPs. (F and G) Immunofluorescence levels (intensity) of PLCβ3-IR NPs in contra- or ipsilateral DRG neurons of different size categories [all sizes (E); small <600 μm2 and medium-sized 600-1400 μm2 (F)] 2 weeks after SNI. No significant effects are seen. (H) Percentage of PLCβ3-IR NPs in the contra- and ipsilateral DRGs after carrageenan injection. No significant effects are seen. Error bars represent standard error of the mean (SEM). Significant differences are indicated by *, P < 0.05; **, P < 0.01 compared with contralateral DRGs. (Scale bar: 50 μm, A–B.)

