Fig. 4.
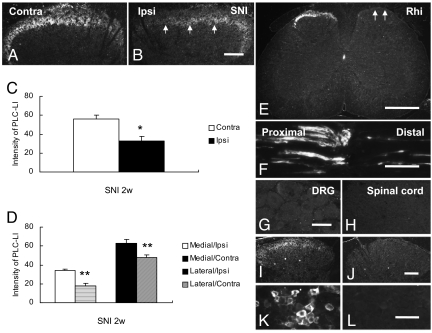
Expression of PLCβ3 in spinal cord, sciatic nerve, and control experiments. (A and B) Immunofluorescence micrographs of PLCβ3-LI in lumbar spinal cord 2 weeks after SNI. PLCβ3-IR fibers are mainly located in lamina II of the contralateral dorsal horn (A), with a strong ipsilateral reduction after SNI (B, arrows). No PLCβ3-IR cell bodies can be seen. (C) Quantitative evaluation of spinal dorsal horn shows a significant reduction of PLCβ3-LI (gray levels) 2 weeks after SNI (*, P < 0.05 compared with contralateral side). (D) SNI results in reduction of PLCβ3-LI (gray levels) in both lateral and medial portions of ipsilateral lamina I-II. (E) PLCβ3-LI is strongly reduced ipsilaterally 2 weeks after dorsal rhizotomy (Rhi) (arrows). (F) PLCβ3-LI strongly accumulates on the proximal side of a crush. (G and H) After incubation with control serum, no fluorescent positive neurons or fibers can be observed, in neither the DRG (G) nor spinal dorsal horn (H). (I–L) PLCβ3 signal is absent in dorsal horn (J) and DRG (L) of PLCß3−/− mouse as compared with wild type mouse (I and K). Significant differences are indicated by *, P < 0.05; **, P < 0.01 compared with contralateral side. (Scale bars: 100 μm, A–B; G–H; I–J; K–L).

