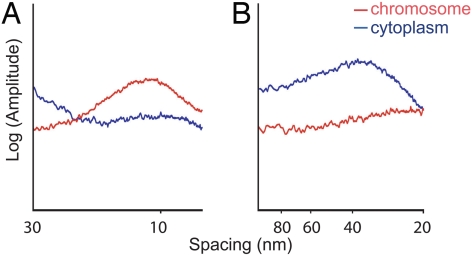
Fig. 3.
Averaged 1-DRAPS of chromosomes (red) and cytoplasm (blue) after CTF correction reveals characteristic spacing peaks. Two ranges of spacing are shown: from 7 to 30 nm (A) and from 20 to 100 nm (B). A broad peak of spacing with a maximum of ≈11.3 nm is observed for the chromosomes, whereas no peaks within this range are detected for the cytoplasm. In the 20–80 nm range, the chromosomal texture shows no spacing peaks. In contrast, a peak with maximum at ≈30 nm is detected in the cytoplasm.

