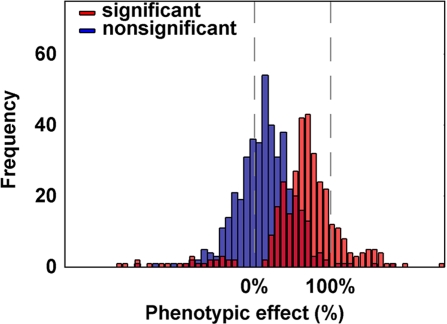
Fig. 1.
Frequency distribution of phenotypic effects in C57BL/6J-ChrA/J/NaJ CSSs. For the 41 traits that differed significantly between the parental strains, phenotypic effects for CSSs that differed significantly from C57BL/6J are indicated in red, and those that did not differ significantly are indicated in blue. Phenotypes are normalized, so that C57BL/6J = 0% and A/J = 100%.

