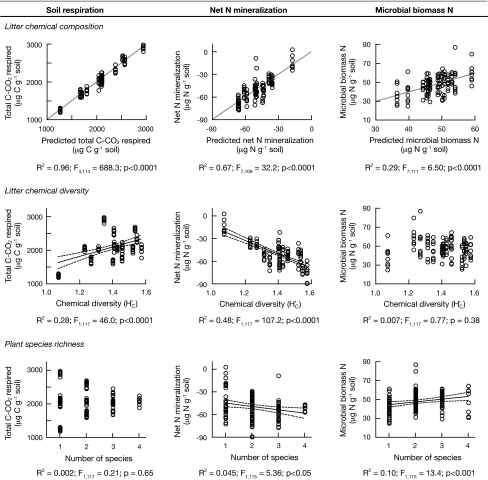
Fig. 2.
Soil respiration, net N mineralization, and microbial biomass N as a function of litter chemical composition (Top), litter chemical diversity (H′C) (Middle), and plant species richness (Bottom). (Top) Predicted values were derived from multiple regression models that used PC axis scores and their interactions as independent variables. Results for net N mineralization and microbial biomass N multiple regressions were obtained using natural log-transformed response variables, but untransformed data are graphed for comparison purposes. Gray lines represent the hypothetical 1:1 relationship between observed values and predicted values from the models. (Middle) The linear regression of soil respiration as a function of litter chemical diversity was performed using natural log-transformed response data, but untransformed data are graphed. (Bottom) For linear regressions of soil respiration and net N mineralization as a function of plant species richness, response variables were natural log-transformed, but untransformed data are graphed. Dashed lines in Middle and Bottom represent the 95% confidence intervals of the regression lines.

