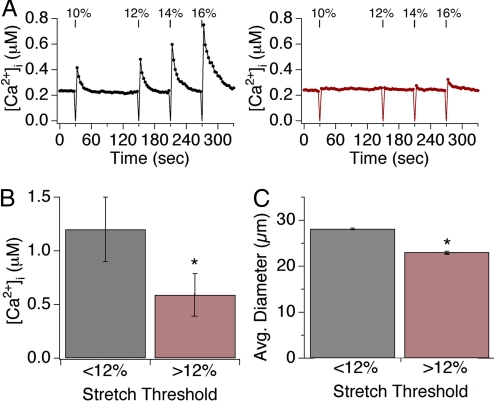
Fig. 2.
Two subsets of sensory neurons display varying sensitivity to stretch. (A) Representative responses of individual neurons to four subsequent applications of radial stretch 10, 12, 14, and 16%. Low-threshold neurons respond to all magnitudes of stretch (black, Left graph), whereas a high-threshold neuron responded only to stretch magnitudes ≥12% (red, Right graph). (B) Low-threshold neurons displayed significantly larger peak calcium transients in response to all levels of stretch versus those observed in high-threshold neurons. (C) Neurons showing sensitivity to low stretch intensity had relatively large soma diameters (28 ± 2.7 μm), whereas those responding only at higher magnitudes were significantly smaller (23 ± 1.4 μm; P < 0.05, one-way ANOVA). Asterisks denotes P < 0.05; n ≥ 10 trials/data point, with ≥30 neurons/trial.

