Fig. 3.
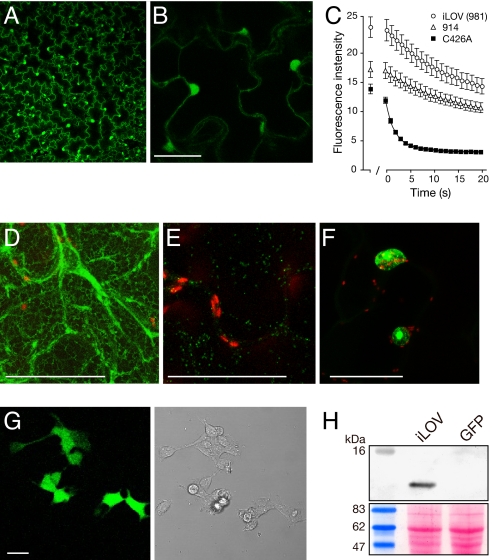
Expression and subcellular targeting of iLOV in Nicotiana benthamiana and HEK cells. (A) Virus-based expression of free iLOV from a TMV vector. (B) Higher magnification of free iLOV expression showing both cytosolic and nuclear localization. (Scale bar, 50 μm.) (C) Photobleaching kinetics of LOV variants expressed in epidermal cells. LOV-mediated fluorescence from nuclei was used to quantify fluorescence loss in response to repeated scanning at 40% laser power. The first scan was used to focus on nuclei to be imaged and quantified. After 1 min, a series of 20 images was collected every s. Values represent the mean ± SE (n = 21). (D) iLOV targeted to the endoplasmic reticulum with TMV.SP-iLOV-HDEL. (Scale bar, 50 μm.) (E) iLOV targeted to the Golgi from TMV.ST-iLOV (indicated in green). Chloroplast autofluorescence is indicated in red. (Scale bar, 50 μm.) (F) iLOV expressed as a C-terminal fusion to Arabidopsis histone 2B. (Scale bar, 50 μm.) (G) Fluorescence imaging of free iLOV expressed in HEK cells. Bright field image is shown on the right. (Scale bar, 20 μm.) (H) iLOV accumulation in HEK cells detected by Western blotting using anti-iLOV antibody. HEK cells expressing GFP were used as a control. Ponceau S staining of the immunoblot below shows equal protein loading (20 μg).

