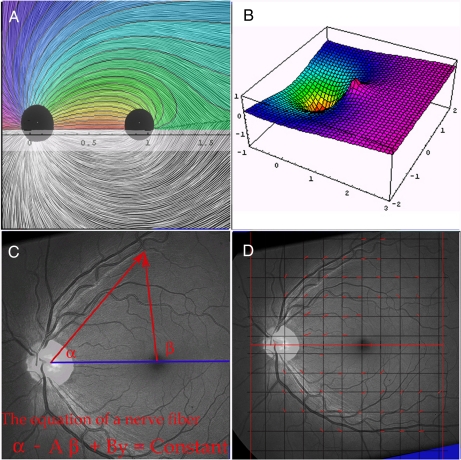
Fig. 1.
Definitions and technique. (A) A pen and ink drawing of the human retina by P.J.A. The dark disk on the left represents the optic disk and the rightmost disk is the perimacular area. The upper half has been overlaid by the matching curves of our mathematical model with parameters A = 0.379418 and B = 0.303835. (B) Graph of hypothetical potential function, F, with parameters A = 0.4 and B = 0.1. Nerve fibers are postulated to move in the direction of steepest decline downhill. The depression at coordinates (0, 0) represents the optic nerve sink and the peak (truncated) at (0, 1) is the macular source. Notice the ridge from the macular peak, creating the horizontal raphe watershed. (C) Retina 1 with graphic illustrating geometric definitions of the angles a and b. (D) Grid (spacing 0.2 in x–y coordinates) laid over photo of retina I. Red line segments indicate the NFL direction at points of lattice L.

