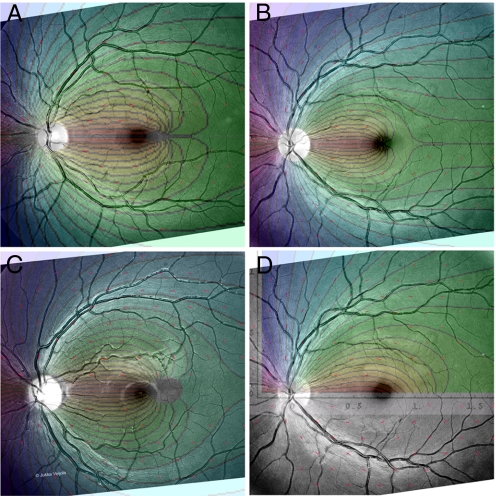
Fig. 4.
Retinal photos with lattice K of and corresponding theoretical contour plots, calculated from K data for Retina5 (A), Retina6 (B), Retina7 (C), and Retina6 and lattice K (D), now showing theoretical overlay for streak potential using parameters in Table 2.

