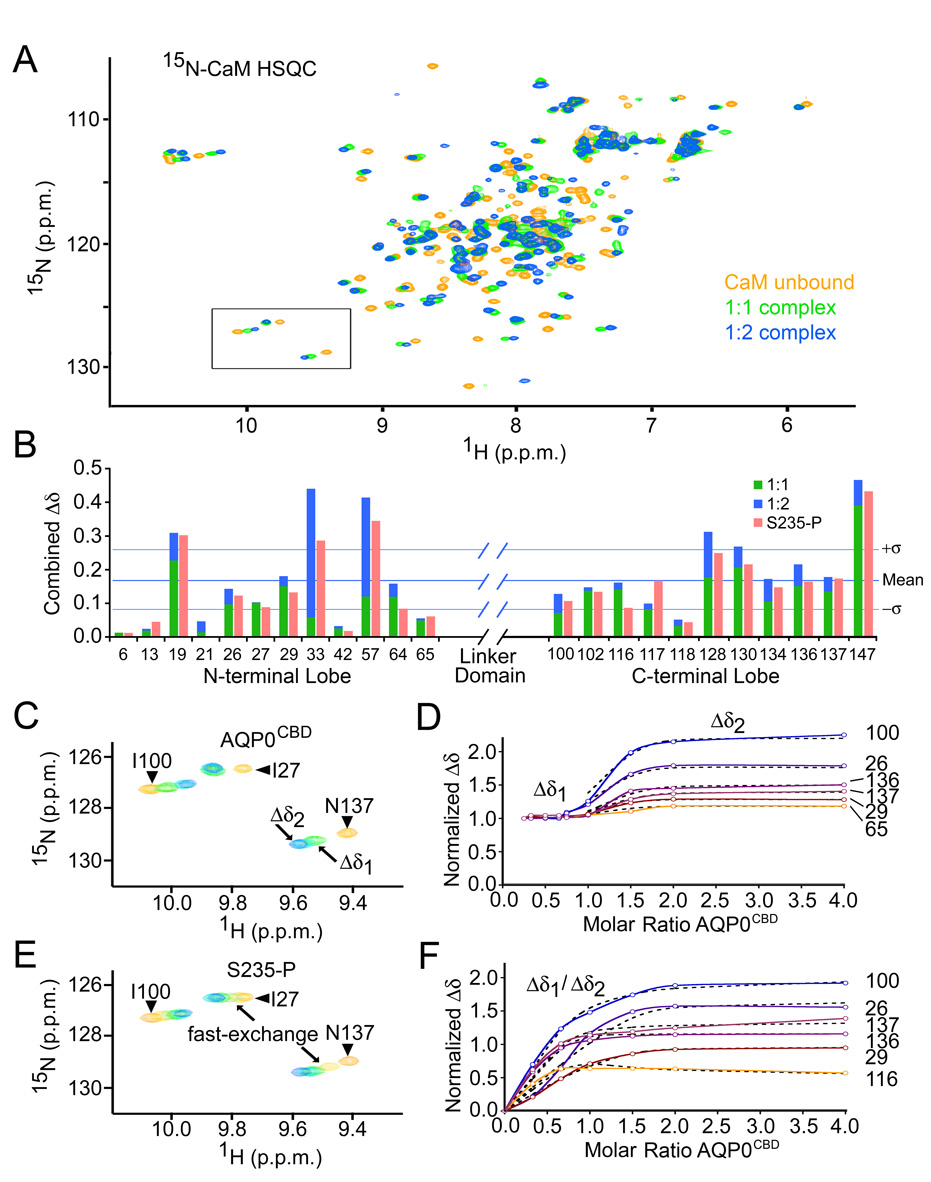
Figure 3. Calmodulin binds two AQP0CBD peptides in a step-wise manner.
A, Overlay of 15N-calmodulin HSQC spectra of unbound (yellow), singly bound (green) and doubly bound (blue) species in the presence of Ca2+. B, Combined 1H/15N chemical shift changes (Δδ) for several amino acids from the N- and C-lobes of calmodulin. Green and blue bars correspond to Δδ values from the 1:1 and 1:2 complexes, respectively. Red bars correspond to the overall Δδ values from the S235-P titration. Horizontal lines indicate the mean and standard deviation of the overall Δδ values from the AQP0CBD titration. C, Close-up view of the boxed area from panel A, for AQP0CBD. Residue assignments are identified in the figure. Arrows indicate different points in the titration experiment, corresponding to singly bound (Δδ1) and doubly bound (Δδ2) 15N-calmodulin species. D, Titration curves of normalized Δδ values for several 15N-calmodulin residues versus mole ratio of AQP0CBD peptide (colored and labeled). The flat portion of the trace “Δδ1” indicates slow-exchange. Theoretical fits to the fast exchange Δδ2 used to obtain binding constants are overlaid in black hatch lines. E and F, are the same as C and D, but were obtained for the S235-P modified AQP0CBD. In E, arrows indicate S235-P titration points that resulted in fast-exchange. In F, the titration data for both binding events were fit to a two-state binding isotherm.

