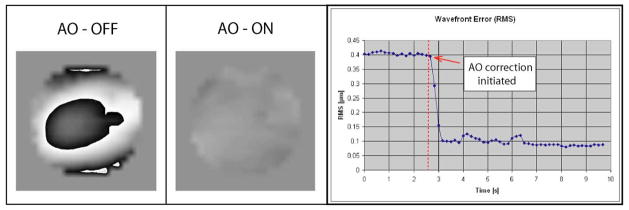
Fig. 6.
The ocular wavefront measured by H-S wavefront sensor before (left) and after (center) AO-correction. Left and center images present the reconstructed PSF for these wavefronts. Right plot shows total wavefront RMS error over time as measured by the H-S wavefront sensor before and during correction. The RMS error was corrected at a rate of 25 Hz but is displayed at rate of 6 Hz.

