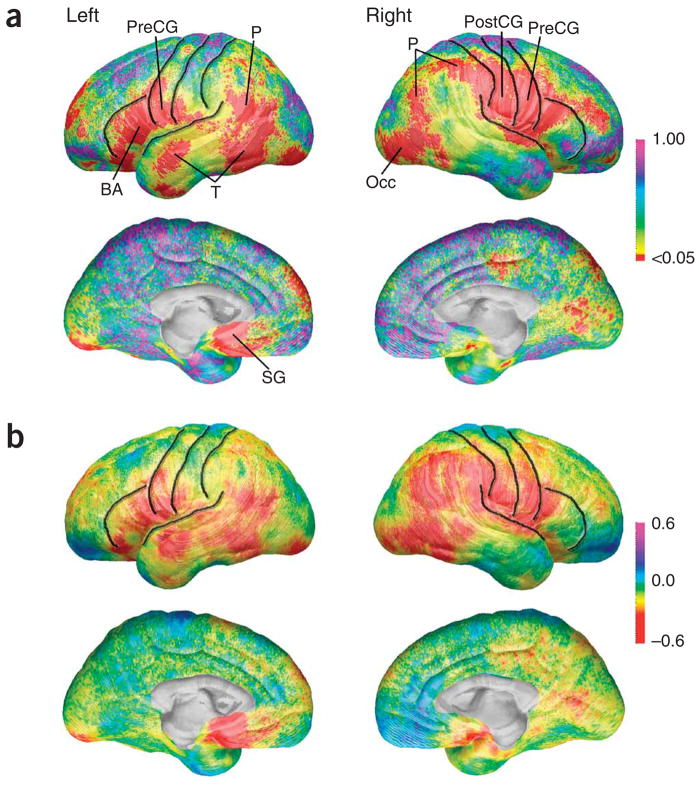
Figure 1.
Cortical thickness group differences. (a) Statistical P maps of the effect of diagnosis on cortical thickness with intelligence quotient statistically controlled. P maps are color-coded as indicated (also applies to Fig. 2a,b). Regions in red are statistically significant (uncorrected, P < 0.05). Regions in purple or pink do not approach significance (P approaching 1.0). Central, precentral and postcentral sulci, which bound the precentral and postcentral gyri, and the inferior frontal sulcus and Sylvian fissure are superimposed in black. Broca’s area, BA; occipital cortex, Occ; parietal cortex, P; postcentral gyrus, PostCG; precentral gyrus,PreCG; subgenual, SG; temporal cortex, T. (b) Cortical thickness differences in millimeters. Maps of differences between the entire group of Tourette syndrome and control subjects in thickness of gray matter (Tourette syndrome coded 1, controls coded 0 for all maps shown) showing differences in gray matter (in millimeters) between the Tourette syndrome and control subjects, as indicated by the color bar. Warmer colors (<0 on the color bar) indicate regions where the gray matter thickness is less in the Tourette syndrome subjects than in the control subjects, and cooler colors (>0) indicate regions where individuals with Tourette syndrome have greater gray matter thickness than the control subjects. Note that cortical thickness in Tourette syndrome subjects is reduced bilaterally in ventral frontal and parieto-occipital regions by approximately 0.45 mm. These maps are constructed without any brain scaling and represent decreases in absolute thickness of the cortex in the Tourette syndrome group.

