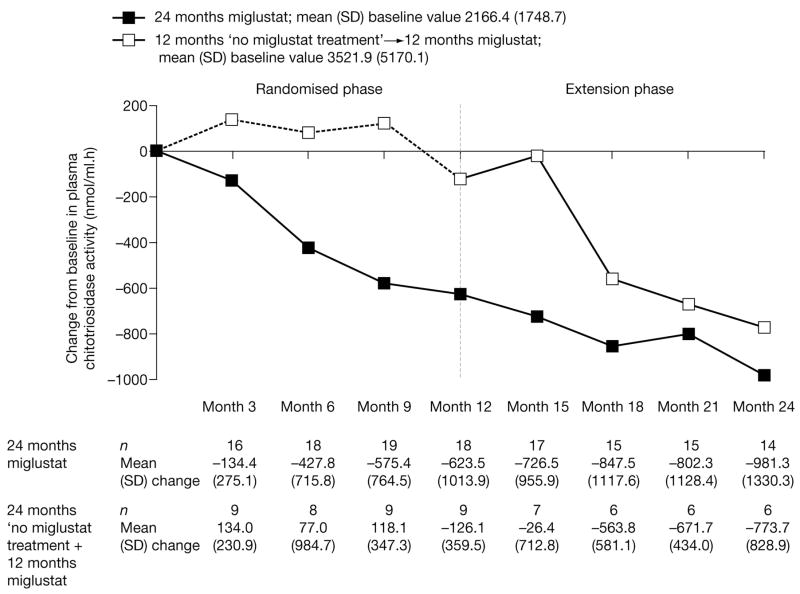
Fig 4.
Changes from baseline in plasma chitotriosidase activity during miglustat treatment. Black squares represent 24 months miglustat with mean (standard deviation [SD]) baseline value of 2166.4 (1748.7); white squares represent 12 months no miglustat treatment plus 12 months miglustat with mean (SD) baseline value of 3521.9 (5170.1).

