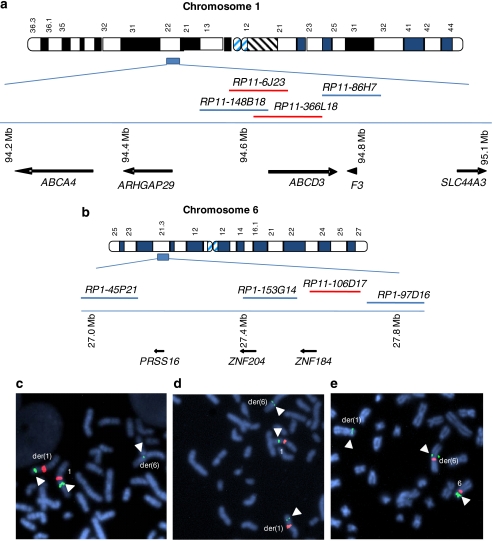
Figure 1.
Delineation of translocation breakpoint regions and candidate genes. Physically mapped BAC clones used in FISH analysis of chromosome 1 (a) and chromosome 6 (b) are indicated. Clones spanning the breakpoint are shown in red. Candidate genes from the region flanking the breakpoint regions are noted with arrows showing direction of transcription. FISH analysis of the 1p22.1 breakpoint spanning clones RP11–366L18 (green) (c) and clone RP11–6J23 (green) (d). Chromosome 1 centromeric control probes are shown in red. FISH analysis of the 6p22.1 breakpoint spanning clone RP11–106D17 (green) (e). Chromosome 6 centromeric control probes are shown in red.

