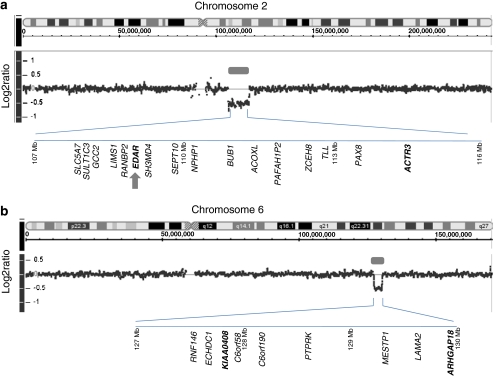
Figure 3.
Array CGH profiles of chromosome 2 (a) and chromosome 6 (b) in patient CMS8770 are shown. The location of deletion at 2q12.2 and 6q22.3 are indicated by gray bars. The log2 ratio of about −0.5 indicates the deletions are heterozygous. A representative gene content of the deletion is shown in each case. For a complete list of genes, see the gene content map of the corresponding region (NCBI). The deletions at 2q12.2q14.1 and 6q22.3 were further confirmed by real-time genomic PCR using DNA isolated from patient's blood. Genes used for real-time genomic PCR are indicated in bold types. The location of the EDAR gene on chromosome 2q12.2 is indicated by the gray arrow.

