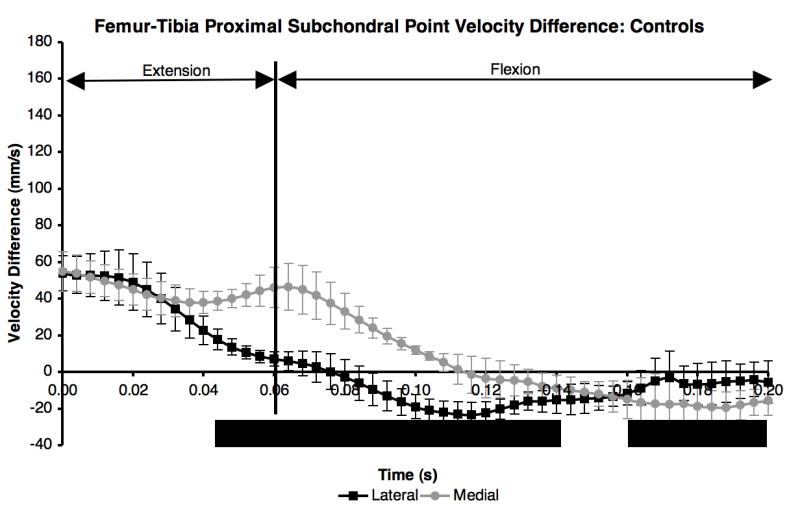
Figure 2.

Difference in proximal subchondral point velocity within each compartment for the five control dogs. Mean curves ± 1 SD for the ten test sessions were significantly different (KS test, p < 0.05) from 40 ms after paw strike to 140 ms after paw strike, and again from 160 ms to 200 ms after paw strike.
