
Figure 7.
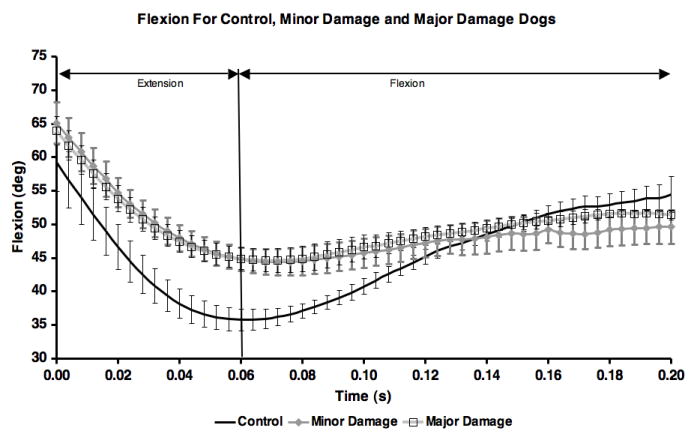
Mean flexion angle for each of the three groups. Error bars are ± one standard deviation. Means for control group include all 10 test sessions. Means for minor and major damage groups are for ccl-deficient test sessions (sessions 2-10).
Official websites use .gov
A
.gov website belongs to an official
government organization in the United States.
Secure .gov websites use HTTPS
A lock (
) or https:// means you've safely
connected to the .gov website. Share sensitive
information only on official, secure websites.
Mean flexion angle for each of the three groups. Error bars are ± one standard deviation. Means for control group include all 10 test sessions. Means for minor and major damage groups are for ccl-deficient test sessions (sessions 2-10).