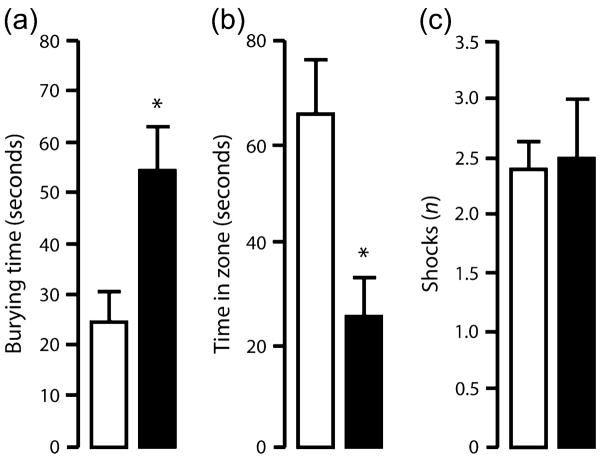
Figure 5. Shock-probe defensive burying test.
TIP39-KO spent more time engaged in defensive burying (a) and spent less time near the probe (b), but received a similar number of shocks (c), in the shock-probe defensive burying test when compared with WT. WT = open bars, KO = solid bars. Data are mean ± SEM; n = 10/genotype. *P < 0.05.

