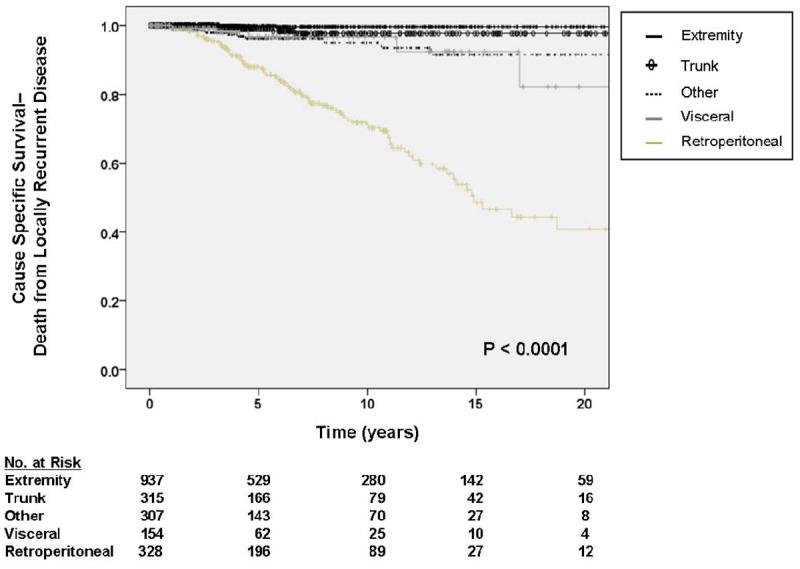
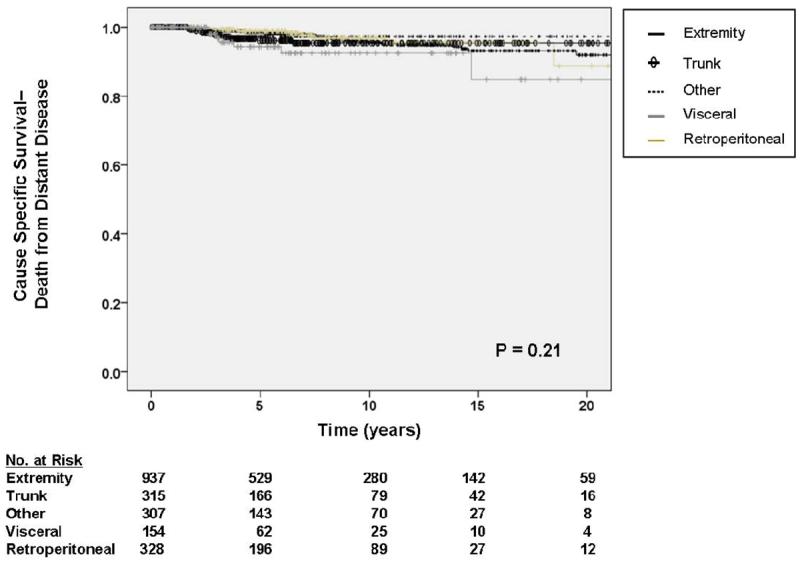
Figure 3.


A. Kaplan-Meier curve depicting cause-specific survival (death from locally recurrent disease) grouped by site of primary tumor. Other sites include thoracic, head and neck, and skin locations. Visceral includes gastrointestinal, gynecologic, and genitourinary. Pooled univariate P value is shown. B. Kaplan-Meier curve depicting cause-specific survival (death from distant disease) grouped by site of primary tumor. Other sites include thoracic, head and neck, and skin locations. Visceral includes gastrointestinal, gynecologic, and genitourinary. Pooled univariate P value is shown.
