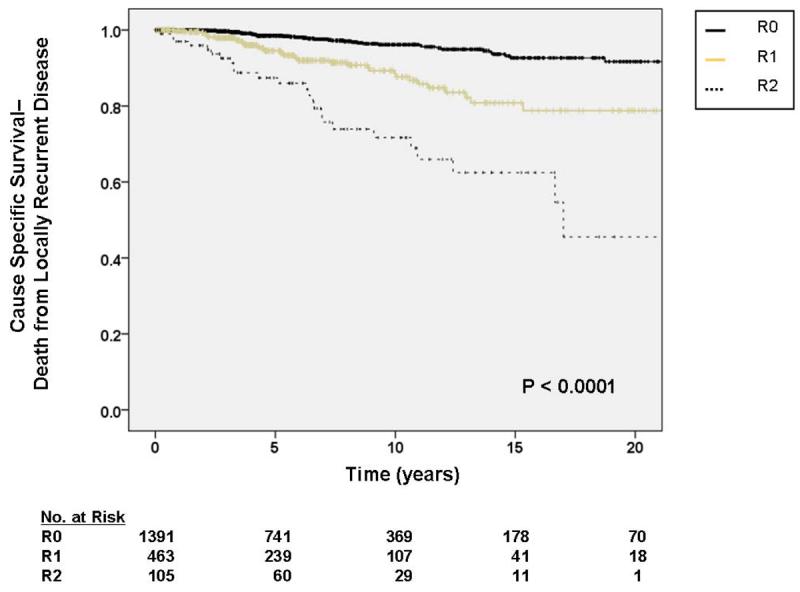
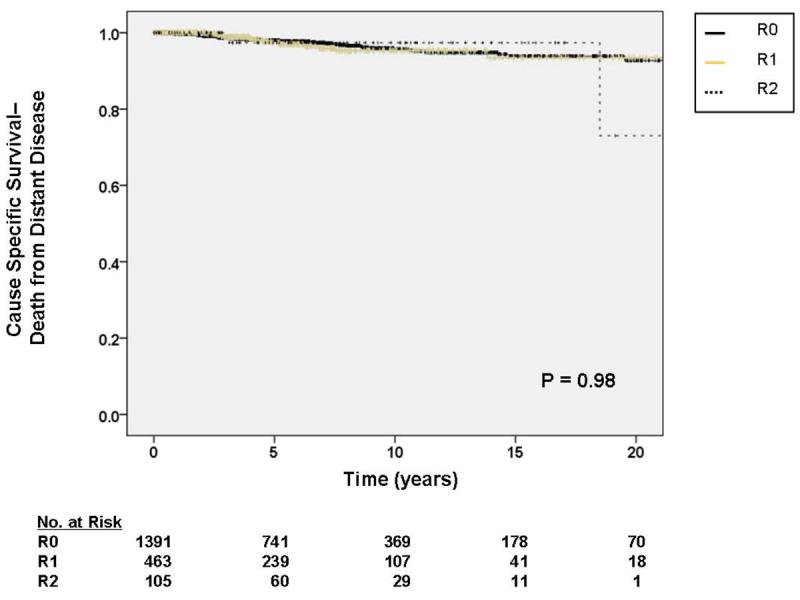
Figure 4.


A. Kaplan-Meier curve depicting cause-specific survival (death from locally recurrent disease) grouped by completeness of resection/status of resection margins. Pooled univariate P value is shown. B. Kaplan-Meier curve depicting cause-specific survival (death from distant disease) grouped by completeness of resection/status of resection margins. Pooled univariate P value is shown.
