Figure 2.
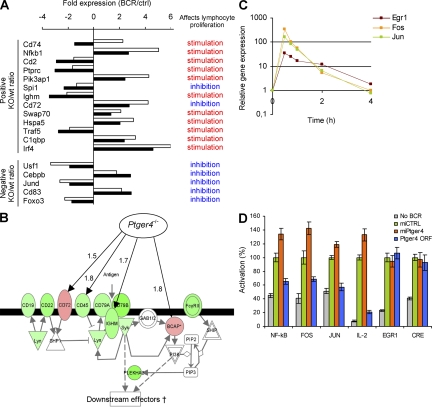
Ptger4 is a negative feedback regulator of BCR-triggered proliferation. (A) Relative expression values and functions of genes known to affect lymphocyte proliferation, according to Ingenuity Pathway Analysis database (IPA; see URLs in Materials and methods). For each gene, the expression ratio in BCR-stimulated (BCR) versus control (ctrl) sample at 2 h is shown (filled bars, wild-type [wt] B cells; open bars, Ptger4−/− [KO] B cells). Genes were ranked according to their absolute ratios in descending order. (B) Proximal part of the BCR-signaling canonical pathway. The molecules whose encoding genes showed at least a twofold change in expression upon BCR-triggering of wild-type B cells are colored (green, down-regulation; red, up-regulation). Black arrows indicate genes that showed at least a 50% difference in expression between Ptger4−/− and wild-type B cells. Numbers indicate fold induction caused by the lack of Ptger4. (C) BCR-induced expression of the immediate-early genes Egr1, Fos, and Jun in A20 cell line. (D) A20 cells were cotransfected with plasmids encoding GFP cocistronic with nontargeting miRNA (miCTRL) or miRNA targeting Ptger4 (miPtger4b) or the Ptger4 ORF, together with the indicated luciferase reporter plasmid. The knockdown efficiency was similar to that achieved in stable cell lines (Fig. 3 A). Luminescence was determined after BCR stimulation as detailed in Materials and methods. Error bars are the SD of triplicates. To exclude the possibility of saturation, the assay for EGR1 and CRE activity was also performed at a lower concentration (5 μg/ml) of anti-IgG F(ab′)2 (Fig. S4). Fig. S4 is available at http://www.jem.org/cgi/content/full/jem.20081163/DC1.

