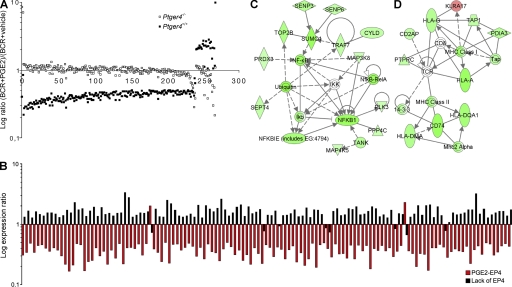
Figure 5.
PGE2–EP4 signaling results in general repression of activating genes. (A) Genes regulated at least twofold in BCR-triggered Ptger4+/+ and/or Ptger4−/− B cells by 1 nM PGE2 at 24 h. For each genetic background, log expression ratios of PGE2-treated (BCR+PGE2) versus vehicle-treated (BCR+vehicle) activated B cells are shown for each gene. The x axis denotes number of genes. (B) Genes that are induced when EP4 is absent are repressed when EP4 is abundant and activated. Shown are the log expression ratios of 128 genes commonly regulated in conditions designated as “lack of EP4” (Ptger4−/− versus Ptger4+/+ BCR-triggered B cells at 2 h) and “PGE2–EP4” (Ptger4+/+ versus Ptger4−/− BCR-triggered and 1 nM PGE2 cotreated B cells at 24 h). The identity of genes and their values are listed in Table S2. (C, D) Genes from the “PGE2–EP4” condition in (B) were connected using the IPA knowledge database. Two most significant and coherent networks consisted of genes associated with the NF-kB pathway (C) and MHC class I and II molecules (D). Green, down-regulated genes; red, up-regulated genes.

