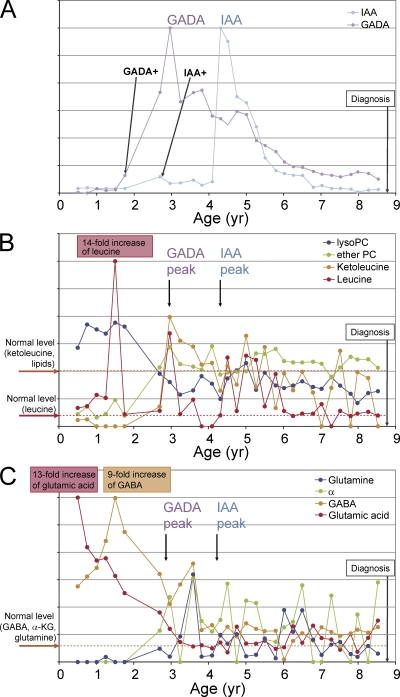
Figure 2.
Selected autoantibody and metabolite changes during the prediabetic period in a girl who progressed to type 1 diabetes at close to 9 yr of age (HLA-haplotype DR7-DQ2/DR4-DQ8, moderate genetic risk). (A) GADA and IAA profiles. The relative autoantibody level values are calculated as the ratio of their measured levels and corresponding cutoff limits for autoantibody positivity. Scales are linear and adjusted separately for each autoantibody for clarity. Time of seroconversion to positivity for each autoantibody is marked, as is the time of diagnosis of type 1 diabetes. The child also seroconverted to ICA and IA-2A autoantibody positivity within 6 mo before the appearance of IAA. (B) Changes of ketoleucine, leucine, lysoPC (the profile shown is for the most abundant lysoPC species PC(18:0/0:0)), and ether PC (the profile shown is for the most abundant ether PC species PC(O-18:1/20:4)) with age. Fold changes are calculated as ratios of metabolite level at a given time point and the normal level, i.e., the mean value across all samples in the nonprogressors. Scales are linear and adjusted separately for each metabolite for clarity. (C) The changes of glutamic acid, GABA, α-ketoglutarate (α-KG), and glutamine with age.

