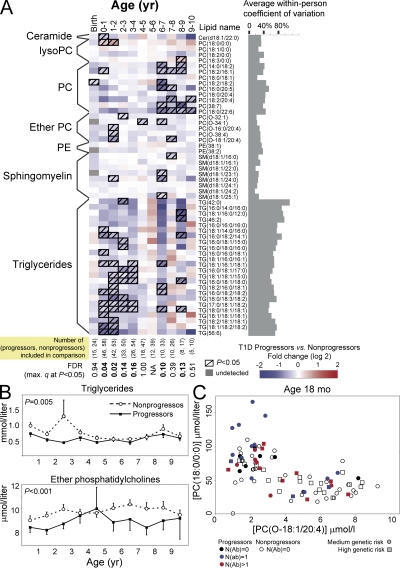
Figure 3.
Serum lipidome in cord blood and prospective sample series. (A) Differences in serum lipidome between the progressors to type 1 diabetes and nonprogressors who remained autoantibody negative throughout the follow up. The age groups are divided into birth (cord blood) and then into groups covering 1-yr cohorts. Only one sample per subject, closest to the mean age within the time window, is used in each comparison. The number of subjects included in each age cohort is shown at the bottom. The last sample of each progressor was the sample drawn last before diagnosis of diabetes. (B) Total triglyceride and ether PC concentrations for the age cohorts shown in A calculated as the sum of lipid concentrations within each class. Both lipid classes were found consistently down-regulated in the progressors, as tested by the linear mixed effects model for the overall trend throughout the follow up. The error bars show SEM. (C) Levels of the lysoPC PC(18:0/0:0) and the ether PC PC(O-18:1/20:4) at the age of 18 mo for DIPP children. The two lipids were up-regulated (P = 0.0009) and down-regulated (P = 0.04) in progressors, respectively. Only one measurement, closest to the age of 18 mo within the 12–24-mo age interval is shown for each subject. Subjects who already seroconverted to autoantibody positivity against one or multiple islet autoantigens are specifically marked with different colors, whereas the subjects in moderate and high HLA-conferred risk groups, as defined in Table I, are marked with circles and squares, respectively.

