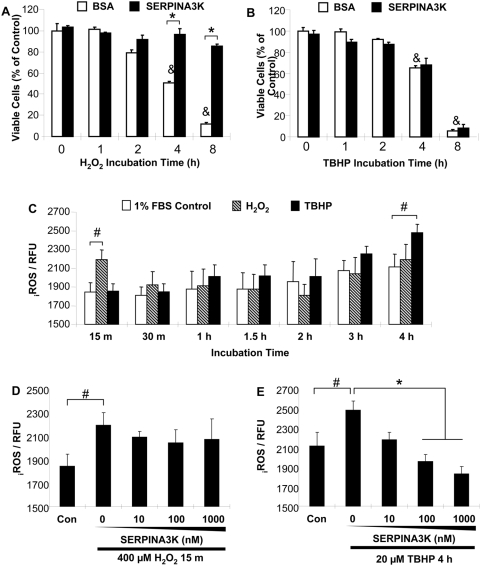
Figure 3. Lack of effect of SERPINA3K on the intracellular ROS generation in cells exposed to H2O2.
(A, B) The rMC-1 cells were treated with 400 µM H2O2 (A) or 20 µM TBHP (B) for 1, 2, 4 and 8 h in the absence or presence of 1 µM BSA or SERPINA3K. Viable cells were quantified using MTT assay (mean±SEM, n = 3). (C) The rMC-1 cells were exposed to 400 µM H2O2 or 20 µM TBHP for various durations as indicated, to define the time point for the ROS increase. Note that ROS levels were elevated by H2O2 as early as 15 min, while the ROS generation induced by TBHP occurred at 4 h of the treatment. (D&E) rMC-1 cells were pre-treated with various concentrations of SERPINA3K for 1 h. The medium was supplemented with BSA to the same total protein concentration in each well. The cells were then exposed to 400 µM H2O2 for 15 min (D) or to 20 µM TBHP for 4 h (E). The intracellular ROS generation was measured using CM-H2DCFDA as a probe. Values are arbitrary fluorescence units (mean±SEM, n = 8). SERPINA3K blocked the ROS increase induced by TBHP but not that by H2O2. * P<0.01, the SERPINA3K-treated cells versus the BSA-treated cells. & P<0.01, the BSA-treated cells exposed to H2O2 versus the BSA-treated cells without H2O2 exposure. # P<0.05, the H2O2 or TBHP-treated cells versus control cells.

