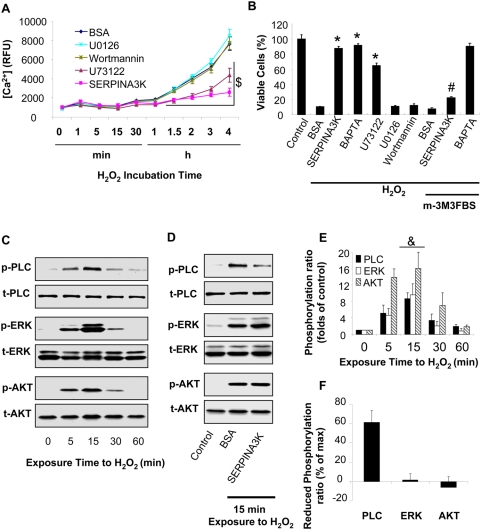
Figure 6. SERPINA3K inhibits the H2O2-induced calcium overload and necrosis via PLC but not the ERK or PI3K/Akt pathways.
(A) The rMC-1 cells were treated with 400 µM H2O2 in the presence of 1 µM SERPINA3K, 250 nM U73122 (PLC inhibitor), 10 µM U0126 (ERK inhibitor), 100 nM Wortmannin (PI3K inhibitor) or 10 µM BAPTA. BSA (1 µM) was used as negative control. Intracellular [Ca2+] was measured using the fluorescence of the probe Fluo-4/AM at different intervals of the treatment (mean±SEM, n = 6). (B) The protective effects of the inhibitors and 1 µM SERPINA3K against the H2O2-induced cell death with or without 10 µM m-3M3FBS (PLC activator) were quantified by the MTT assay after exposure to H2O2 for 8 h (mean±SEM, n = 3). (C) The rMC-1 cells were treated with 400 µM H2O2. The cells were harvested at different time points for Western blotting. (D) The cells were exposed to H2O2 for 15 min in the presence of 1 µM SERPINA3K or BSA. The phosphorylated PLC-γ1 (p-PLC), ERK1/2 (p-ERK) and Akt (p-AKT) were blotted with phosphorylation-specific antibodies. The total PLC-γ1 (t-PLC), ERK1/2 (t-ERK) and Akt (t-AKT) were blotted with antibodies for total proteins. (E) Protein levels was quantified using densitometry of the Western blotting results (mean±SEM, n = 3). (F) The reduced phosphorylation level of each kinase was shown as percentages of the maximum phosphorylation levels at 15 min exposure (mean±SEM, n = 3). $ P<0.01, under H2O2 exposure from 1.5 h to 4 h; the U73122 and SERPINA3K-treated cells versus the BSA-treated cells. * P<0.01, versus control cells. # P<0.01, the cells treated with H2O2, m-3M3FBS and SERPINA3K versus the cells treated with H2O2 and SERPINA3K. & P<0.01, versus control cells exposed to H2O2 for 0 min.

