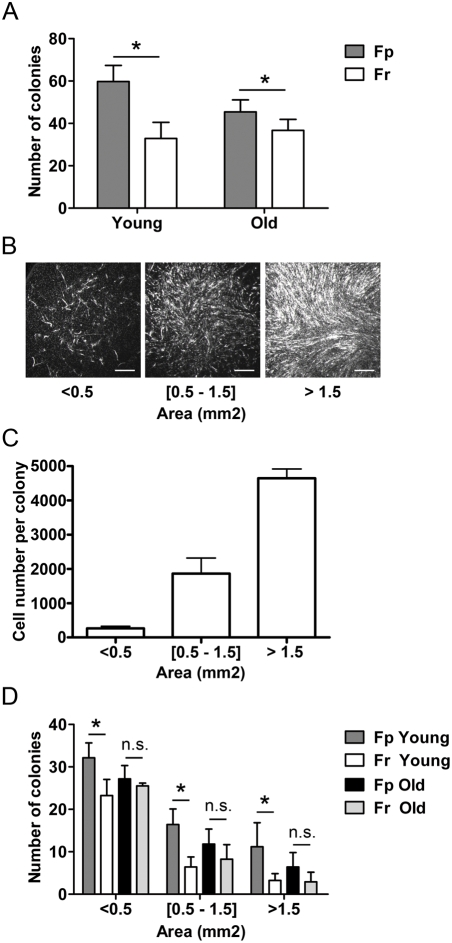
Figure 6. Evolution with age of Fp and Fr clonogenic capacity.
The growth capacity of Fp and Fr samples from 4 young (19 yr, 21 yr, 23 yr, and 26 yr) and 4 old donors (57 yr, 60 yr, 63 yr, and 74 yr) was analyzed in term of colony-forming efficiency (CFE) and size of the colonies generated by these different fibroblast samples. (A) Comparison of the CFE of Fp and Fr from young and old donors. Data are expressed as number of colonies obtained from 100 plated fibroblasts (means±SEM, n = 4, independent samples). Colonies were classified according to their individual area (mm2). (B) Photographs of colonies of typical ‘small’, ‘intermediate’, and ‘large’ size. Scale bars = 50 µm. (C) Correspondence between colony area (mm2) and fibroblast number (means±SEM, n = 10 colonies per size category). (D) Comparison of the sizes of colonies generated by Fp and Fr from young and old donors. The histogram shown corresponds to the number of colonies obtained from 100 plated fibroblasts (means±SEM, n = 4, independent samples), (*p<0.05; n.s. = not significant).

